Three-Dimensional Stability Analysis in an Open-Pit Iron-Ore Mine
This project was developed in an iron-ore open-pit mine located in Brazil, which exhibits outcrops of friable rock units with a high contrast in rock stiffness between the different rock units of the deposit and a presence of a shear band in between units. Therefore, this study was aimed at understanding the failure mechanisms acting on the slopes. Considering the background information and the characteristics of the rock units at the site, FLAC3D was chosen as the best tool to correctly represent this problem. The study was based on three specific stages: (i) Compilation and review of the geological, geotechnical and structural information of the site, (ii) Calibration stage based on reproducing to the best possible extent three documented instabilities, and (iii) Predictive stage for the stability conditions of the slopes in future design (final pit), plus interramp angle (IRA) recommendations.
Project Background
An iron-ore open-pit mine located in Brazil has experienced several documented instabilities. These events have been distributed in almost all slopes of the mine, inducing failure events that range from a single bench scale up to 150 m-high bench stacks. Most of these failure events correspond to circular failures, which have occurred in different time scales, where each of these have been responsible for halting operations in the local areas of failure. In this context, it is critical assessing the stability condition of future mining of the mine and analyzing if the interramp slope angles being used (IRAs) are well suited for the rock mass units present in the deposit.
This study aims to understand the failure mechanisms acting on the mine slopes, so that a reliable predictive three-dimensional geotechnical stability analysis can be performed and so that recommendations on the design slope angles can be obtained.
To accomplish the objective of the study, this project was planned in terms of three stages of work:
i. Initial stage based on a process of compilation and review of the data,
ii. Calibration stage based on reproducing to the best possible extent three instabilities recorded and documented in slopes of the mine,
iii. Predictive stage for the stability conditions of the slopes in one future design (final pit), and interramp angle (IRA) recommendations.
Geology of the Deposit
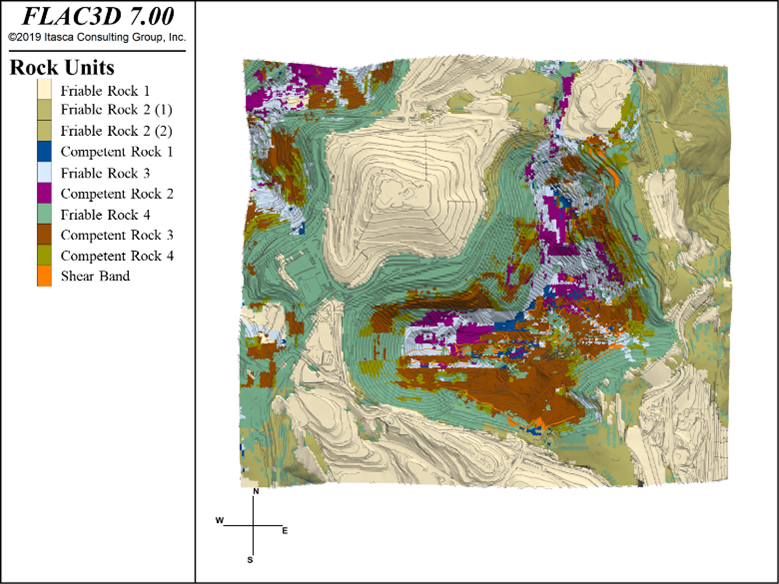
This deposit exhibits 11 lithologies ranging from friable rock units (which are extremely weak rocks), and competent rock units. The contrast between friable and competent rocks is evident not only in the strength properties, but also is characterized by a high contrast in rock stiffness.
The main feature identified in the rock units, with special importance in the friable rock units, is the presence of foliation and bedding planes. In some parts of the mine, the orientation of these planes is unfavorable to the slope design.
Notwithstanding the above, as an iron-ore deposit, the ferrous formation is delimited from a mafic formation by a shear band which exhibits significantly low strength parameters and has been a contributor to instabilities whenever it daylights in the slope
Selection of Constitutive Models
Due to the geological set of the mine deposit, the following approach was adopted:
- Friable rock units with strong features in terms of beddings or foliations, were represented by an elasto-plastic model with a Mohr-Coulomb failure envelope and ubiquitous joints anisotropy,
- Friable rock units without structure presence and competent rock units were represented by a standard elasto-plastic model with a Mohr-Coulomb failure envelope.
Methodology
The overall methodology is presented in this section, along with the description of the models used in each stage of the project.
Calibration of Documented Instabilities
Three FLAC3D calibration models were built, one for each documented instability. For each model, the iteration process started with the mean value of each property for each rock unit (provided by the Client). Nonetheless, as the calibration process progressed, the values were updated keeping their magnitudes within the measured range according to the test data.
The process finished when a set of calibrated rock parameters that reproduces both the documented instabilities and the current pit behavior was found. The analysis of the current pit comprised the testing of the calibrated parameters in order to assess how well they reproduce the actual conditions of the current pit.
Predictive Analysis and Interramp Angle (IRA) Recommendations
The outcome of the predictive analysis is the assessment of the stability conditions of the Final Pit based on the use of calibrated properties. This is achieved through the calculation of Factor of Safety (FoS) using the Shear Strength Reduction (SSR) technique. Also, recommendations of the IRA are provided.
Calibration Results
This section shows the results of simulating each instability using the final set of calibrated parameters.
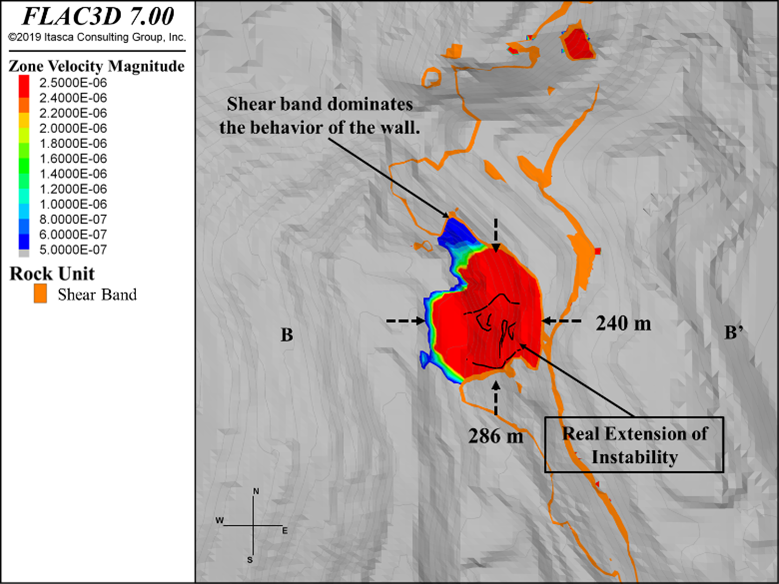
Instability 1
As shown in Figure 1, the model shows a reasonable correlation with the documented instability. Although the model overpredicts the Northmost extension of the documented failure, the extension to the South, in the East-West axis and in Vertical are reasonable.
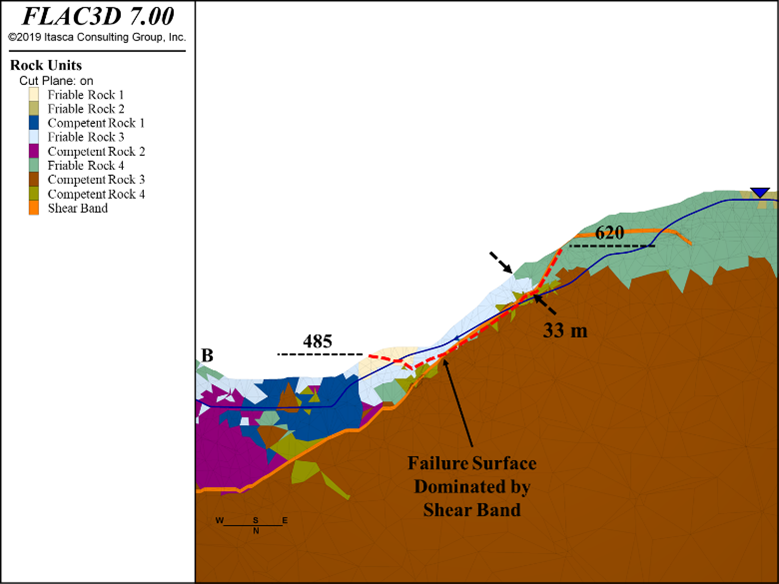
In Section BB’ (N = 1440) we observe a failure surface that encompasses from level 485 to 620 (failure height of 135 m) reaching a failure depth of 33 m. When compared to the reported failure, which reached a maximum height of 105 m, the model is considered to be reasonable.
It is relevant to notice the role of the shear band in controlling of the failure extension. Because of the lower strength of this shear band, it becomes a preferential failure surface, controlling the stability of this area.
Instability 2
The instability 2 could not be reproduced. After several attempts, it was concluded that more factors need to be added to the model to represent the observed behavior.
Instability 3
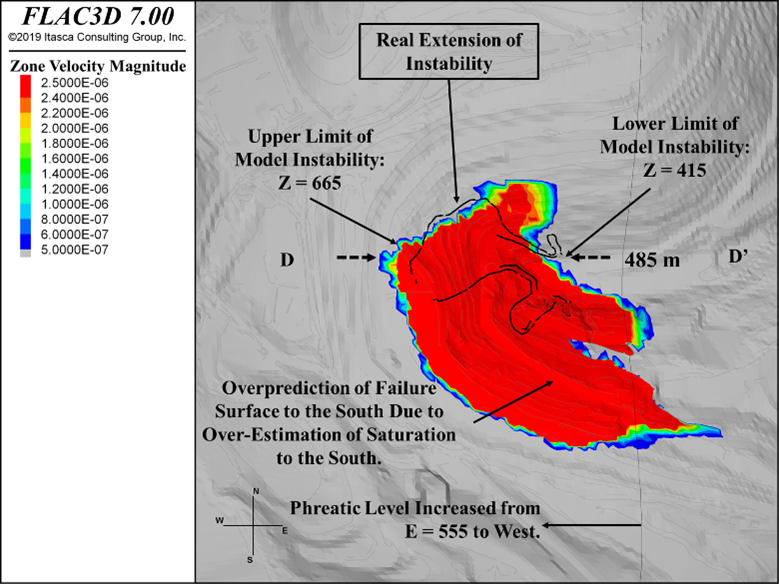
For the calibration of instability 3, the phreatic level was arbitrarily raised up to 20 m below the surface of the pit. This was done to reproduce the saturation conditions reported in the documented instability. This approach is aimed at representing the reported lack of proper dewatering in the area where the instability occurred, but unfortunately also over-estimates the influence of water elsewhere outside the failed area.
As shown in Figure 2, the model shows a fair correlation with the documented instability. When comparing the model prediction against the documented failure contour, it is necessary to emphasize the following:
- The model reproduces reasonably well the extent of the failure in the North and West slopes.
- The model overpredicts the extension of the failure surface to South, mainly due to the over estimation of saturation, and also due to the presence of the shear band to the South East.
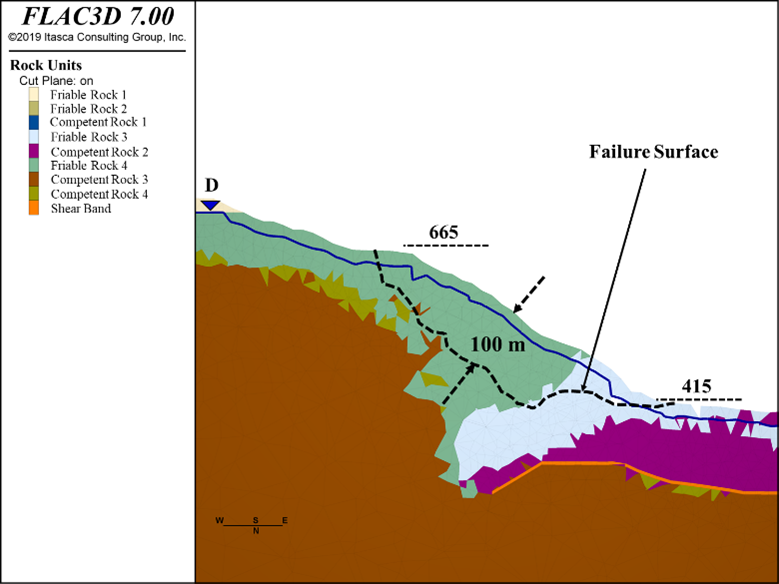
In Section DD’ (N = 310) the model exhibits a failure surface that involves from level 415 to 665 (failure height of 250 m) reaching a failure depth of 100 m. When compared to the reported failure, which reached a maximum height of 150 m, the model is considered to provide a reasonable result considering the assumption of rising the phreatic level.
Predictive Analysis
Predictive analysis was divided into two branches:
- The first was aimed at assessing the stability condition of the final pit, by characterizing the rock mass with the set of calibrated parameters. To achieve this goal, Factors of Safety were calculated using the Shear Strength Reduction (SSR) technique.
- The second is intended to advice the mine with IRA recommendations for each rock unit, in terms of the calibrated parameters found.
Factors of Safety for Final Pit
The FoS contours are shown in Figure 3.
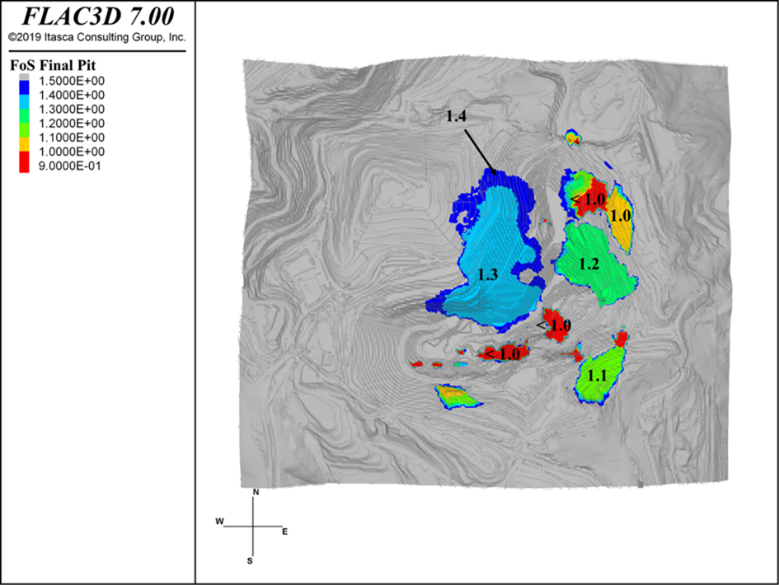
According to the previous figure, the slopes of the final pit exhibit:
- FoS ≤ 1.1 where the shear band configures a geometry of a “Planar Failure” with a small rock bridge or daylighting at the slope.
- 1.1 ≤ FoS ≤ 1.3 where the shear band configure a geometry of a “Planar Failure” where the rock bridge is wide enough to hold the failure but could induce relevant deformations in the form of cracking,
- 1.3 ≤ FoS in rock masses where the failure is expected through the matrix (Circular Failure) and/or promoted by the joints.
All the points stated above stand out the importance of a correct determination of the shear unit in this deposit.
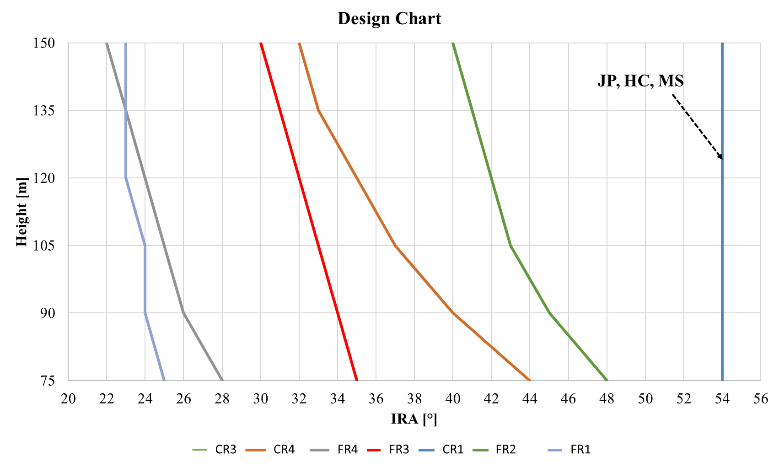
IRA Recommendations
The IRA recommendations were developed using a simplified two-dimensional FLAC/Slope v8.0 analysis, considering the following:
- The analyses were carried out in dry conditions. This must be considered carefully, because the phreatic levels have proven to be a critical contributor to instabilities.
- The acceptability criteria was: FoS ≥ 1.3.
- For the rock units in the mine, they were assessed using only the rock matrix without any faulting or joint sets.
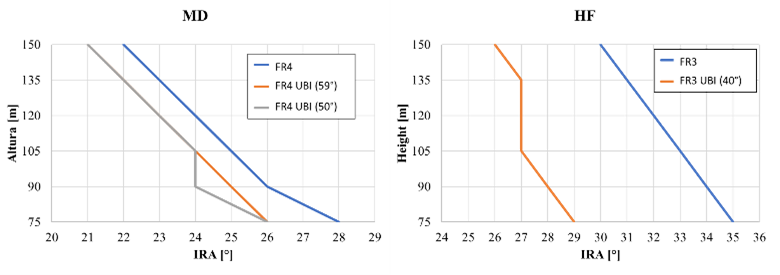
- Due to the importance of joint sets in the Friable Rock 3 (FR3) and Friable Rock 4 (FR4) behavior, according to the results shown previously, it was also assessed the IRAs including the most unfavorable orientations per each that could be found in the model.
The design charts with and without joints are shown in Figure 4.
References
Brady B., Brown E. (2007) Pre-mining state of stress. In: Rock Mechanics for underground mining. Springer, Dordrech.
Heidbach, O., M. Rajabi, X. Cui, K. Fuchs, B. Müller, J. Reinecker, K. Reiter, M. Tingay, F. Wenzel, F. Xie, M. O. Ziegler, M.-L. Zoback, and M. D. Zoback (2018): The World Stress Map database release 2016: Crustal stress pattern across scales. Tectonophysics, 744, 484-498.
Heidbach, Oliver; Rajabi, Mojtaba; Reiter, Karsten; Ziegler, Moritz; WSM Team (2016): World Stress Map Database Release 2016. GFZ Data Services.
Hoek, E., Kaiser, P. K., and W. F. Bawden (1995). “Support of underground excavations in hard rock”, Balkema, Rotterdam.
Hoek, E., Brown, E.T., 1997. Practical estimates of rock mass strength. Int. J. Rock Mech. Min. Sci. Geomech. Abstr. 34, 1165–1186.
Hoek, E. and M. S. Diederichs (2006). “Empirical estimation of rock mass modulus”. International Journal of Rock Mechanics and Mining Sciences, 43, 203-215.
Itasca Consulting Group, Inc (2019), “Explicit Continuum Modeling of Non-linear Material Behavior in 3D (FLAC3D)”, Version 7.0
Lorig, L. and P. Varona (2013). “Guidelines for numerical modelling of rock support for mines”, Ground Support 2013, Australian Centre for Geomechanics, Perth.
Silva, R. and P. Gómez (2015). “Towards a Mechanically Based Definition of the Disturbance Factor Using the ‘Slope Model’ Lattice Code”, Integrating Innovations of Rock Mechanics.